Python 数学、統計、機械学習:重回帰分析
1.重回帰分析
Bostonデータセットの各項目の内容を説明変数として、scikit-learn を用いて線形回帰モデルを作成、重回帰分析を行ってみる。
from sklearn import datasets
import pandas as pd
import statsmodels.formula.api as smf
import matplotlib.pyplot as plt
import numpy as np

def multi_regression(*feature_index):
    """
    重回帰分析


    https://pythondatascience.plavox.info/scikit-learn/%E7%B7%9A%E5%BD%A2%E5%9B%9E%E5%B8%B0
    https://pythondatascience.plavox.info/matplotlib/%E6%A3%92%E3%82%B0%E3%83%A9%E3%83%95
    :return:
    """
    boston = datasets.load_boston()
    df = pd.DataFrame(boston.data)
    df.columns = boston.feature_names
    df['PRICE'] = pd.DataFrame(boston.target)

    x = df.loc[:, ['{0}'.format(x) for x in feature_index]]
    y = df['PRICE']

    model = smf.OLS(y, x)
    result = model.fit()
    print(result.summary())

    # numpy sort
    # https://qiita.com/supersaiakujin/items/c580f2aae90818150b35
    desc_idx = np.argsort(result.tvalues.values)[::-1]
    labels = []
    values = []
    for idx in desc_idx:
        labels.append(feature_index[idx])
        values.append(result.tvalues.values[idx])

    plt.bar(labels, values)
    plt.legend(title="r^2(adj) = {0:.6}".format(result.rsquared_adj))

    plt.show()


if __name__ == "__main__":
    multi_regression('CRIM', 'ZN', 'INDUS', 'CHAS', 'NOX', 'RM', 'AGE', 'DIS', 'RAD', 'TAX', 'PTRATIO', 'B', 'LSTAT')
    # multi_regression('RM', 'AGE', 'TAX', 'B')
分析結果について、summary() メソッドを呼び出すことで、以下の結果表が得られる。
                            OLS Regression Results
==============================================================================
Dep. Variable:                  PRICE   R-squared:                       0.959
Model:                            OLS   Adj. R-squared:                  0.958
Method:                 Least Squares   F-statistic:                     891.1
Date:                Mon, 04 Jun 2018   Prob (F-statistic):               0.00
Time:                        22:53:10   Log-Likelihood:                -1523.8
No. Observations:                 506   AIC:                             3074.
Df Residuals:                     493   BIC:                             3129.
Df Model:                          13
Covariance Type:            nonrobust
==============================================================================
                 coef    std err          t      P>|t|      [0.025      0.975]
------------------------------------------------------------------------------
CRIM          -0.0916      0.034     -2.675      0.008      -0.159      -0.024
ZN             0.0487      0.014      3.379      0.001       0.020       0.077
INDUS         -0.0038      0.064     -0.059      0.953      -0.130       0.123
CHAS           2.8564      0.904      3.160      0.002       1.080       4.633
NOX           -2.8808      3.359     -0.858      0.392      -9.481       3.720
RM             5.9252      0.309     19.168      0.000       5.318       6.533
AGE           -0.0072      0.014     -0.523      0.601      -0.034       0.020
DIS           -0.9680      0.196     -4.947      0.000      -1.352      -0.584
RAD            0.1704      0.067      2.554      0.011       0.039       0.302
TAX           -0.0094      0.004     -2.393      0.017      -0.017      -0.002
PTRATIO       -0.3924      0.110     -3.571      0.000      -0.608      -0.177
B              0.0150      0.003      5.561      0.000       0.010       0.020
LSTAT         -0.4170      0.051     -8.214      0.000      -0.517      -0.317
==============================================================================
Omnibus:                      204.050   Durbin-Watson:                   0.999
Prob(Omnibus):                  0.000   Jarque-Bera (JB):             1372.527
Skew:                           1.609   Prob(JB):                    9.11e-299
Kurtosis:                      10.399   Cond. No.                     8.50e+03
==============================================================================

Warnings:
[1] Standard Errors assume that the covariance matrix of the errors is correctly specified.
[2] The condition number is large, 8.5e+03. This might indicate that there are
strong multicollinearity or other numerical problems.
No handles with labels found to put in legend.
いろいろ警告が出ていますが、結果の見方を知りたい。
説明変数の各項目については、Bostonデータセットを引き続き使用
| 項目 | 内容 |
| 最小二乗回帰(OLS : Ordinary Least Squares regression) | 分析モデルとして最小二乗法を使用 |
| 回帰係数(ceof) | 回帰係数は単位の影響を受けるため、影響度の指標としては利用できない |
| 標準誤差(std err) | 平均からのバラツキを示す指標、分散の正の平方根 |
| t値(t) | 目的変数に対するそれぞれの説明変数の影響度を表す。回帰係数は単位の影響を受け、影響度の指標に利用できないため、回帰係数を標準誤差で除し単位の影響を受けないt値を利用する。t値の絶対値が大きいほど、影響度の強い説明変数といえる |
| P-値 | p値 は、全く効果がない場合(係数=0)に、分析結果として出る係数の値が、A以上になる確率を表す。 |
| 下限97.5% | 97.5%の信頼区間下限。 |
| 上限97.5% | 97.5%の信頼区間上限 |
| 重決定 R2(R-squared) | 寄与率または決定係数と呼ばれ、回帰式全体の精度を表す。1に近いほど制度が高いといえる。 |
| 補正 R2(Adj R-squared) | 自由度調整済み決定係数 |
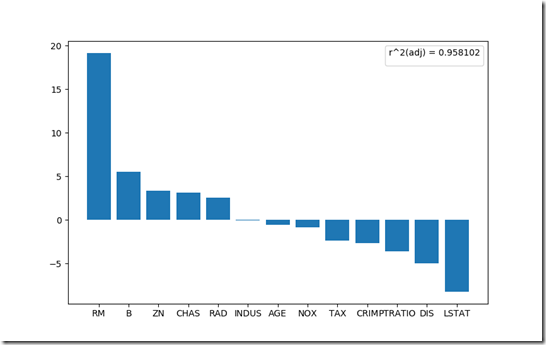
t値を降順にソートして棒グラフにプロット。
住宅価格に影響を与えている変数を分析できる。


