Swift iOSにチャートを組み込む
グラフ用のライブラリを読み込んで、グラフを表示させる。
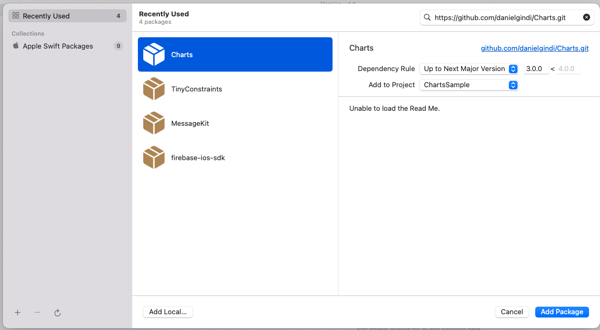
XCode プロジェクトのコンテキストメニューから、Add Package を選択し、上記GiHubリポジトリのURLをダイアログの検索窓に入力。
https://github.com/danielgindi/Charts.git
Add Packageで利用可能になる。
GiHubのトップページにある、チュートリアルを見ながら実装していく。
TinyConstraingsというパッケージも上記チュートリアルで追加しているのだが、なかなかわかりにくい、AutoLayoutをコードで簡潔に設定できるライブラリのようだ。
https://github.com/roberthein/TinyConstraints.git
もCharts同様に、Add Packageしておく。
1.基本的なグラフ
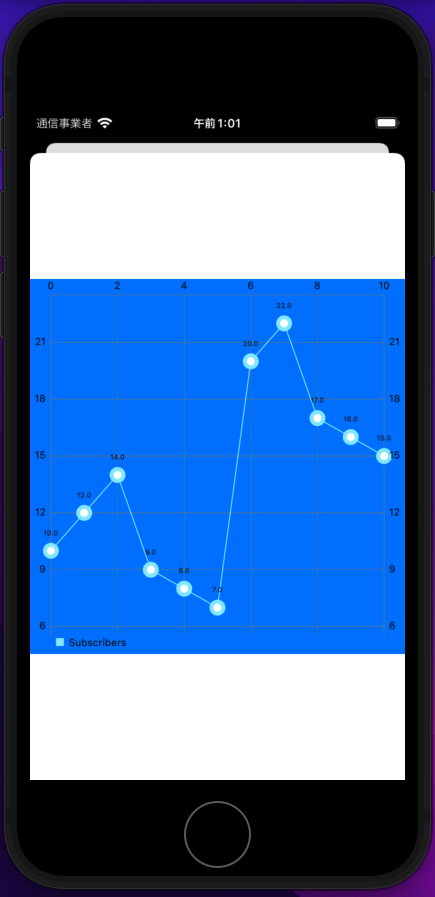
チュートリアルにしたがい、以下のような適当なグラフを作成してみる。
import UIKit
import Charts
import TinyConstraints

//
// https://www.youtube.com/watch?v=mWhwe_tLNE8&list=PL_csAAO9PQ8bjzg-wxEff1Fr0Y5W1hrum&index=6
//
class LineChartViewController: UIViewController, ChartViewDelegate {
        lazy var lineChartView: LineChartView = {
        let charView = LineChartView()
        charView.backgroundColor = .systemBlue
        return charView
    }()
    override func viewDidLoad() {
        super.viewDidLoad()
        // Do any additional setup after loading the view.
                view.addSubview(lineChartView)
                lineChartView.centerInSuperview()
        lineChartView.width(to: view)
        lineChartView.heightToWidth(of: view)
                setData()
    }
    func chartValueSelected(_ chartView: ChartViewBase, entry: ChartDataEntry, highlight: Highlight) {
        print(entry)
    }
    func setData() {
        let set1 = LineChartDataSet(entries: yValues, label: "Subscribers")
        let data = LineChartData(dataSet: set1)
        lineChartView.data = data
    }
    let yValues: [ChartDataEntry] = [
        ChartDataEntry(x: 0.0, y: 10.0),
        ChartDataEntry(x: 1.0, y: 12.0),
        ChartDataEntry(x: 2.0, y: 14.0),
        ChartDataEntry(x: 3.0, y:  9.0),
        ChartDataEntry(x: 4.0, y:  8.0),
        ChartDataEntry(x: 5.0, y:  7.0),
        ChartDataEntry(x: 6.0, y: 20.0),
        ChartDataEntry(x: 7.0, y: 22.0),
        ChartDataEntry(x: 8.0, y: 17.0),
        ChartDataEntry(x: 9.0, y: 16.0),
        ChartDataEntry(x:10.0, y: 15.0)
    ]
}
2.いろいろ設定を弄る
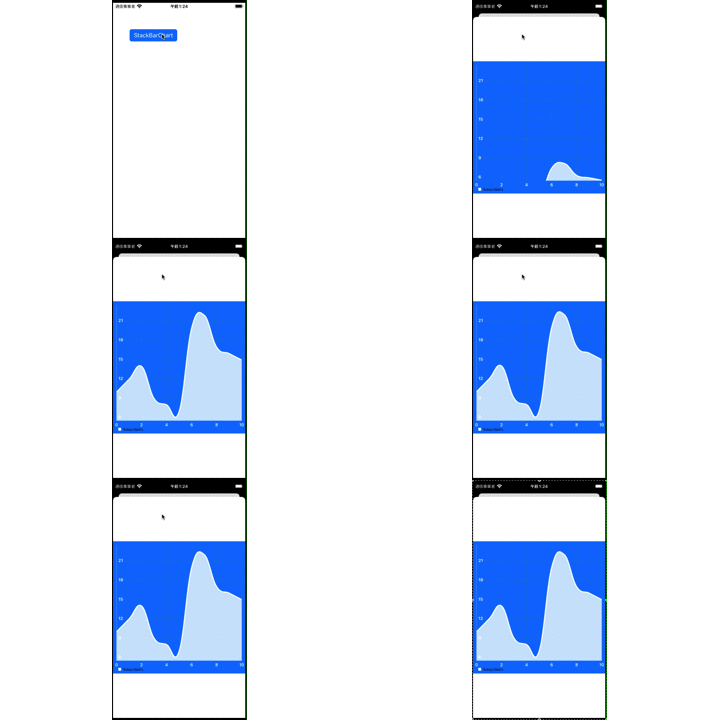
上記で作成したソースに、おもにcharViewを生成したところで各種プロパティを変更、また、DataSetとDataのプロパティも触って、以下のようなアニメーション含みのグラフにすることができた。
import UIKit
import Charts
import TinyConstraints

//
// https://www.youtube.com/watch?v=mWhwe_tLNE8&list=PL_csAAO9PQ8bjzg-wxEff1Fr0Y5W1hrum&index=6
//
class LineChartViewController: UIViewController, ChartViewDelegate {
        lazy var lineChartView: LineChartView = {
        let charView = LineChartView()
        charView.backgroundColor = .systemBlue
        // Customize start
        charView.rightAxis.enabled = false
        let yAxis = charView.leftAxis
        yAxis.labelFont = .boldSystemFont(ofSize: 12)
        yAxis.setLabelCount(6, force: false)
        yAxis.labelTextColor = .white
        yAxis.axisLineColor = .white
        yAxis.labelPosition = .insideChart
        let xAxis = charView.xAxis
        xAxis.labelPosition = .bottom
        xAxis.labelFont = .boldSystemFont(ofSize: 12)
        xAxis.setLabelCount(6, force: false)
        xAxis.labelTextColor = .white
        xAxis.axisLineColor = .systemBlue
        charView.animate(yAxisDuration: 2.5)
        // Customize end
        return charView
    }()
    override func viewDidLoad() {
        super.viewDidLoad()
        // Do any additional setup after loading the view.
                view.addSubview(lineChartView)
                lineChartView.centerInSuperview()
        lineChartView.width(to: view)
        lineChartView.heightToWidth(of: view)
                setData()
    }
    func chartValueSelected(_ chartView: ChartViewBase, entry: ChartDataEntry, highlight: Highlight) {
        print(entry)
    }
    func setData() {
        let set1 = LineChartDataSet(entries: yValues, label: "Subscribers")
        // Customize start
        set1.mode = .cubicBezier
        set1.drawCirclesEnabled = false
        set1.lineWidth = 3
        set1.setColor(.white)
        set1.fill = Fill(color: .white)
        set1.fillAlpha = 0.8
        set1.drawFilledEnabled = true
        // Customize end
        let data = LineChartData(dataSet: set1)
        // Customize start
        data.setDrawValues(false)
        // Customize end
                lineChartView.data = data
    }
    let yValues: [ChartDataEntry] = [
        ChartDataEntry(x: 0.0, y: 10.0),
        ChartDataEntry(x: 1.0, y: 12.0),
        ChartDataEntry(x: 2.0, y: 14.0),
        ChartDataEntry(x: 3.0, y:  9.0),
        ChartDataEntry(x: 4.0, y:  8.0),
        ChartDataEntry(x: 5.0, y:  7.0),
        ChartDataEntry(x: 6.0, y: 20.0),
        ChartDataEntry(x: 7.0, y: 22.0),
        ChartDataEntry(x: 8.0, y: 17.0),
        ChartDataEntry(x: 9.0, y: 16.0),
        ChartDataEntry(x:10.0, y: 15.0)
    ]
}
